5.5 KiB
5.5 KiB
- #ST2001 - Statistics in Data Science I
- Previous Topic: Discrete Probability Distributions: Binomial & Poisson
- Next Topic: Sampling Distributions & Confidence Intervals
- Relevant Slides:
- What is a Normal Distribution? #card
card-last-interval:: -1
card-repeats:: 1
card-ease-factor:: 2.5
card-next-schedule:: 2022-11-15T00:00:00.000Z
card-last-reviewed:: 2022-11-14T20:07:27.457Z
card-last-score:: 1
id:: 63510f7d-d646-41b8-82d7-8634c840892e
- A random variable
Xwith probability distribution function-
f(x) = \frac{1}{\sqrt{2\pi\sigma^2}}e^{\frac{(x - \mu)^2}{2 \sigma^2}} -\infty < x < \infty - is a normal random variable with parameters
\mu&\sigma(where\infty < \mu < \inftyand\sigma > 0) where\muis the mean and\sigmais the standard deviation.
-
- Write
X \sim N(\mu, \sigma^2). 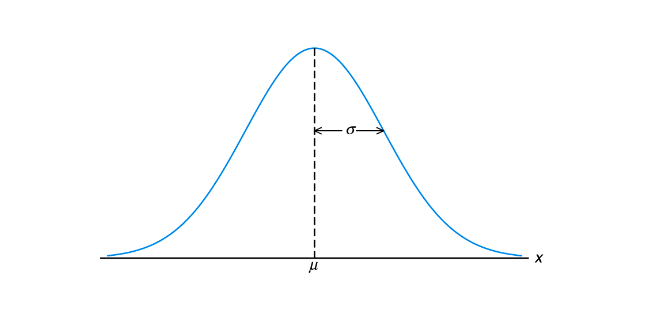
- A random variable
-
Features of the Normal Distribution #card
card-last-interval:: -1 card-repeats:: 1 card-ease-factor:: 2.5 card-next-schedule:: 2022-11-15T00:00:00.000Z card-last-reviewed:: 2022-11-14T20:09:00.438Z card-last-score:: 1- Also called the Gaussian Distribution.
- The pdf (probability density function) is a bell-shaped curve.
- The distribution of many types of observations can be approximated by a Normal Distribution.
- Single mode.
- Symettric.
- Model for continuous measurements.
-
Examples of Normal Distributions
collapsed:: true-
Normal Curves with
\mu_i = \mu_2and\sigma_1 < \sigma_2 -
Normal Curves with
\mu_1 < \mu_2and\sigma_1 < \sigma_2
-
-
Empirical Rule for a Normal Distribution #card
card-last-interval:: -1 card-repeats:: 1 card-ease-factor:: 2.5 card-next-schedule:: 2022-11-15T00:00:00.000Z card-last-reviewed:: 2022-11-14T20:08:32.008Z card-last-score:: 1- For any normal random variable:
-
P(\mu - \sigma < X < \mu + \sigma) = 0.6827 -
P(\mu - 2\sigma < X < \mu + 2\sigma) = 0.9545 -
P(\mu - 3\sigma < X < \mu + 3\sigma) = 0.9973 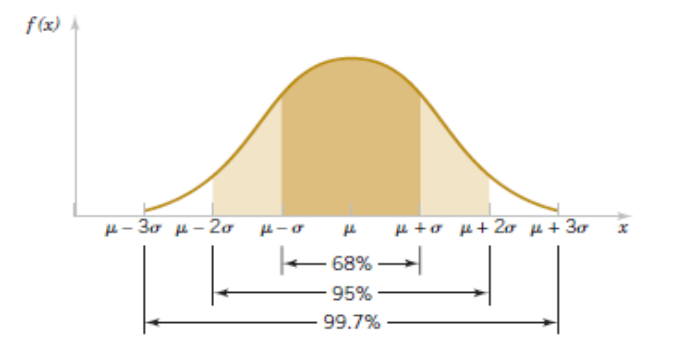 {:height 251, :width 426}
-
-
The 68-95-99.7 Rule
- Normal models give us an idea of how extreme a value is by telling us how likely it is to find one that far from the mean.
- In a normal model:
- About 68% of the values within one standard deviation from the mean.
- About 95% of the values fall within two standard deviations of the mean.
- About 99.7% of the values fall within three standard deviations of the mean.
- For any normal random variable:
-
Areas Under a Normal Curve #card
card-last-interval:: -1 card-repeats:: 1 card-ease-factor:: 2.5 card-next-schedule:: 2022-11-15T00:00:00.000Z card-last-reviewed:: 2022-11-14T20:05:26.550Z card-last-score:: 1- To calculate a probability in a range under a normal distribution.
-
P(x_1 < X < x_2) = \int_{x_1}^{x_2} \frac{1}{\sqrt{2\pi\sigma^2}}e^{\frac{(x - \mu)^2)}{2\sigma^2}}dx
-
- For example.
P(x_1 < X < x_2) =area of the shaded region.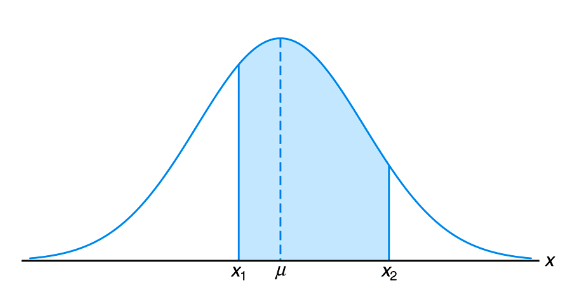 {:height 225, :width 444}
- To calculate a probability in a range under a normal distribution.
-
z-scores
- What is a z-score? #card
card-last-interval:: -1
card-repeats:: 1
card-ease-factor:: 2.5
card-next-schedule:: 2022-11-16T00:00:00.000Z
card-last-reviewed:: 2022-11-15T18:42:43.077Z
card-last-score:: 1
- A z-score reports the number of standard deviations from the mean.
- For example, a z-score of 2 indicates that the observation is two standard deviations above the mean.
-
Converting to z-scores #card
card-last-interval:: -1 card-repeats:: 1 card-ease-factor:: 2.5 card-next-schedule:: 2022-11-15T00:00:00.000Z card-last-reviewed:: 2022-11-14T20:08:12.257Z card-last-score:: 1- To convert a random variable
Xwhich follows aN(\mu, \sigma^2)to a random variableZthat follows a standard normalN(0,1), calculateZas:-
Z = \frac{X - \mu}{\sigma}
-
- Convert
X \sim N(100,100)to a random variableZsuch thatZ \sim N(0,1).
- To convert a random variable
- What is a z-score? #card
card-last-interval:: -1
card-repeats:: 1
card-ease-factor:: 2.5
card-next-schedule:: 2022-11-16T00:00:00.000Z
card-last-reviewed:: 2022-11-15T18:42:43.077Z
card-last-score:: 1
-
Cumulative Distribution Functions
collapsed:: true- How is the cumulative distribution function of a standard normal random variable denoted? #card
card-last-interval:: -1
card-repeats:: 1
card-ease-factor:: 2.5
card-next-schedule:: 2022-11-19T00:00:00.000Z
card-last-reviewed:: 2022-11-18T18:34:54.021Z
card-last-score:: 1
- The cumulative distribution function of a standard normal random variable is denoted as
\Phi(z) = P(Z \leq z)
- The cumulative distribution function of a standard normal random variable is denoted as
- How is the cumulative distribution function of a standard normal random variable denoted? #card
card-last-interval:: -1
card-repeats:: 1
card-ease-factor:: 2.5
card-next-schedule:: 2022-11-19T00:00:00.000Z
card-last-reviewed:: 2022-11-18T18:34:54.021Z
card-last-score:: 1
-
Normal Approximation to the Poisson
- If
Xis a Poisson random variable withE(X) + \lambdaandV(X) = \lambda,-
Z = \frac{X-\lambda}{\sqrt{\lambda}}
-
- The approximation is good for
\lambda \geq 5.
- If
-
Continuity Correction
- Using the Normal Distribution to approximate a discrete distribution (e.g., Binomial) we need to take into account the fact that the Normal Distribution is continuous.
- |
\textbf{Discrete}| |\textbf{Continuous}| |P(X > k)|\rightarrow|P(X > k + \frac 1 2)| |P(X \geq k)|\rightarrow|P(X > k - \frac 1 2)| |P(X < k)|\rightarrow|P(X < k - \frac 1 2)| |P(X \leq k)|\rightarrow|P(X < k + \frac 1 2)| |P(k_1 < X < k_2|\rightarrow|P(k_1 + \frac 1 2 < X < k_2 - \frac 1 2)| |P(k_1 \leq X \leq k_2)|\rightarrow|k_1 - \frac 1 2 < X < k_2 + \frac 1 2|
- |
- Using the Normal Distribution to approximate a discrete distribution (e.g., Binomial) we need to take into account the fact that the Normal Distribution is continuous.


