13 KiB
13 KiB
- #ST2001 - Statistics in Data Science I
- Previous Topic: null
- Next Topic: Sampling
- Relevant Slides:
-
What is / are Statistics?
collapsed:: true- What is a statistic? #card
card-last-interval:: 4
card-repeats:: 2
card-ease-factor:: 2.66
card-next-schedule:: 2022-11-26T13:40:07.042Z
card-last-reviewed:: 2022-11-22T13:40:07.042Z
card-last-score:: 5
- A statistic is any quantity computed from sample data.
- What is the Science of Statistics?
card-last-interval:: 10.24
card-repeats:: 3
card-ease-factor:: 2.56
card-next-schedule:: 2022-10-13T16:37:15.281Z
card-last-reviewed:: 2022-10-03T11:37:15.284Z
card-last-score:: 5
- The collecting, classifying, summarising, organising, analysing, estimation, and interpretation of information.
- What is the role of statistics?
card-last-interval:: 9.28
card-repeats:: 3
card-ease-factor:: 2.32
card-next-schedule:: 2022-10-09T18:10:56.000Z
card-last-reviewed:: 2022-09-30T12:10:56.000Z
card-last-score:: 5
- The field of statistics deals with the collection, presentation, analysis, and use of data to:
- make decisions
- solve problems
- design products & processes
- Statistics is the ^^science of uncertainty.^^
- The field of statistics deals with the collection, presentation, analysis, and use of data to:
- What is the role of probability in statistics?
- Probability provides the framework for the study & application of statistics.
- What is a statistic? #card
card-last-interval:: 4
card-repeats:: 2
card-ease-factor:: 2.66
card-next-schedule:: 2022-11-26T13:40:07.042Z
card-last-reviewed:: 2022-11-22T13:40:07.042Z
card-last-score:: 5
-
Types of Statistics
collapsed:: true- What is Descriptive Statistics? #card
card-last-interval:: 41.44
card-repeats:: 5
card-ease-factor:: 2.18
card-next-schedule:: 2022-12-30T04:36:51.695Z
card-last-reviewed:: 2022-11-18T18:36:51.696Z
card-last-score:: 3
- Descriptive Statistics is the science of summarising data, both numerically & graphically.
- The analysis methods applicable depends on the variable being measured and the research questions that you are trying to answer.
- What is Inferential Statistics? #card
card-last-interval:: 4
card-repeats:: 2
card-ease-factor:: 2.66
card-next-schedule:: 2022-11-26T13:37:26.721Z
card-last-reviewed:: 2022-11-22T13:37:26.722Z
card-last-score:: 3
- Inferential Statistics is the science of using the ^^information in your sample^^ to ^^infer^^ something about the population of statistics.
- What is Descriptive Statistics? #card
card-last-interval:: 41.44
card-repeats:: 5
card-ease-factor:: 2.18
card-next-schedule:: 2022-12-30T04:36:51.695Z
card-last-reviewed:: 2022-11-18T18:36:51.696Z
card-last-score:: 3
-
Important Terms
collapsed:: true- What is an experimental unit? #card
collapsed:: true
card-last-interval:: 33.64
card-repeats:: 4
card-ease-factor:: 2.9
card-next-schedule:: 2022-12-18T07:44:53.701Z
card-last-reviewed:: 2022-11-14T16:44:53.701Z
card-last-score:: 5
- An experimental unit / individual is a single object upon which we collect data. e.g., a person, thing, transaction, or event.
- What is a population? #card
collapsed:: true
card-last-interval:: 33.64
card-repeats:: 4
card-ease-factor:: 2.9
card-next-schedule:: 2022-12-18T07:49:52.921Z
card-last-reviewed:: 2022-11-14T16:49:52.922Z
card-last-score:: 5
- A population is a ^^collection of experimental units^^ / individuals that we are interested in studying.
- What is a sample? #card
card-last-interval:: 33.64
card-repeats:: 4
card-ease-factor:: 2.9
card-next-schedule:: 2022-12-18T07:51:36.002Z
card-last-reviewed:: 2022-11-14T16:51:36.002Z
card-last-score:: 5
- A sample is a subset of experimental units from the population.
- What is a variable? #card
collapsed:: true
card-last-interval:: 10.64
card-repeats:: 3
card-ease-factor:: 2.66
card-next-schedule:: 2022-11-25T07:35:49.776Z
card-last-reviewed:: 2022-11-14T16:35:49.776Z
card-last-score:: 5
- A variable is a ^^characteristic or property of an individual experimental unit^^.
- A variable may be measured, or more generally "observed" on each individual.
- What is Qualitative Data? #card
card-last-interval:: 8.72
card-repeats:: 3
card-ease-factor:: 2.18
card-next-schedule:: 2022-11-23T09:37:05.082Z
card-last-reviewed:: 2022-11-14T16:37:05.082Z
card-last-score:: 3
- Qualitative Data is data which can be classified into categories.
- Two types of Qualitative Data:
- Ordinal: ordered qualitative data - e.g., a grade,
- Nominal: unordered qualitative data - e.g., a gender, a method of payment
- What is Quantitative Data? #card
card-last-interval:: 30.47
card-repeats:: 4
card-ease-factor:: 2.76
card-next-schedule:: 2022-12-15T07:21:06.252Z
card-last-reviewed:: 2022-11-14T20:21:06.252Z
card-last-score:: 5
- Quantitative Data is data in the form of counts or numbers - it cannot be classified into categories.
- Two types of Quantitative Data:
- Discrete: non-divisible, single points of data, counts - e.g., number of texts sent
- Continuous: measurements that, if placed on a number scale, can be placed in an infinite number of spaces between two whole numbers - e.g., age, rent, temperature
- What is an experimental unit? #card
collapsed:: true
card-last-interval:: 33.64
card-repeats:: 4
card-ease-factor:: 2.9
card-next-schedule:: 2022-12-18T07:44:53.701Z
card-last-reviewed:: 2022-11-14T16:44:53.701Z
card-last-score:: 5
- Pie charts make data very difficult to interpret & read - don't use them.
-
Numerical Summaries
-
Central Tendency
- What is a numerical summary? #card
card-last-score:: 5
card-repeats:: 5
card-next-schedule:: 2023-02-06T22:21:22.599Z
card-last-interval:: 84.1
card-ease-factor:: 2.76
card-last-reviewed:: 2022-11-14T20:21:22.599Z
- A numerical summary is a way of summarising categorical data using a frequency count or percentage.
- How do you calculate the sample mean? #card
card-last-interval:: 29.26
card-repeats:: 4
card-ease-factor:: 2.66
card-next-schedule:: 2022-12-13T22:47:38.996Z
card-last-reviewed:: 2022-11-14T16:47:38.997Z
card-last-score:: 5
- Suppose that the observations in a sample are
x_1,\ x_2,\ ...\ ,\ x_n. The sample mean, denoted by\bar{x}, is:-
\bar{x} = \sum_{i=1}^{n}\frac{x_i}{n}=\frac{x_1+x_2+...+x_n}{n}:LOGBOOK: CLOCK: [2022-09-12 Mon 18:35:39] :END:
-
- ^^The sample mean is sensitive to extreme values^^
- Suppose that the observations in a sample are
- How do you calculate the sample median? #card
card-last-interval:: 8.72
card-repeats:: 3
card-ease-factor:: 2.18
card-next-schedule:: 2022-11-23T09:49:27.636Z
card-last-reviewed:: 2022-11-14T16:49:27.637Z
card-last-score:: 5
- Given that the observations in a sample are
x_1,\ x_2,\ ...\ ,\ x_n, arranged in increasing order of magnitude, the sample median is:-
\bar{x} = \begin{cases}x_{(n+1)/2}, & \text{if $n$ is odd},\\ \frac{1}{2}(x_{n/2} + x_{n/2+1}), &\text{if $n$ is even.} \\ \end{cases} - ^^The sample median is not sensitive to extreme values.^^
-
- Given that the observations in a sample are
- What is the mode? #card
card-last-interval:: 33.64
card-repeats:: 4
card-ease-factor:: 2.9
card-next-schedule:: 2022-12-18T07:51:42.814Z
card-last-reviewed:: 2022-11-14T16:51:42.815Z
card-last-score:: 5
- The mode is the most frequent observation in a dataset.
- What is a numerical summary? #card
card-last-score:: 5
card-repeats:: 5
card-next-schedule:: 2023-02-06T22:21:22.599Z
card-last-interval:: 84.1
card-ease-factor:: 2.76
card-last-reviewed:: 2022-11-14T20:21:22.599Z
-
Variation
collapsed:: true- What is the range of a sample? #card
collapsed:: true
card-last-interval:: 33.64
card-repeats:: 4
card-ease-factor:: 2.9
card-next-schedule:: 2022-12-18T07:51:53.283Z
card-last-reviewed:: 2022-11-14T16:51:53.283Z
card-last-score:: 5
- The range of a sample is the maximum - minimum.
- The range is a ^^poor measure of spread and is badly affected by outliers.^^
- The range is also ^^badly affected by outliers.^^
-
Interquartile Range
- What is the interquartile range of a sample? #card
card-last-interval:: 41.44
card-repeats:: 5
card-ease-factor:: 2.18
card-next-schedule:: 2022-12-26T06:18:35.901Z
card-last-reviewed:: 2022-11-14T20:18:35.901Z
card-last-score:: 5
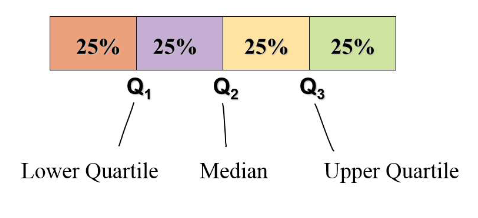
- The interquartile range is the middle 50% of the data.
- Therefore, it is ^^robust to outliers.^^
- To calculate the IQR, first split the data in 4 quarters and subtract the value at
Q_3from the value atQ_1.-
IQR=Q_3-Q_1
-
- The interquartile range is the middle 50% of the data.
-
Tukey's Method for IQR
- There are also many other methods for calculating IQR.
-
- Put data in ascending order.
- The lower quartile (
Q_1)is the median of the lower 50% of the data, including the median. - The upper quartile (
Q_3) is the median of the upper 50% of the data, including the median.
- What is the interquartile range of a sample? #card
card-last-interval:: 41.44
card-repeats:: 5
card-ease-factor:: 2.18
card-next-schedule:: 2022-12-26T06:18:35.901Z
card-last-reviewed:: 2022-11-14T20:18:35.901Z
card-last-score:: 5
-
Standard Deviation #card
card-last-interval:: 4.14 card-repeats:: 2 card-ease-factor:: 2.56 card-next-schedule:: 2022-11-27T15:16:26.346Z card-last-reviewed:: 2022-11-23T12:16:26.350Z card-last-score:: 5- A common measure of spread is the standard deviation, which takes into account how far each data value is from the mean.
- A deviation is the distance of a datapoint from the mean.
- Since the sum of all the deviations would be zero, we square each deviation and find an average of the deviations called the variance.
- We then get the positive square root of the sample variance to get the the sample standard deviation, which is preferable to the sample variance, as the sample variance is in squared units.
- The standard deviation is ^^sensitive to outliers.^^
- How do you calculate the sample variance, and hence, the sample standard deviation? #card
card-last-interval:: 10.97
card-repeats:: 3
card-ease-factor:: 2.56
card-next-schedule:: 2022-11-25T15:37:19.443Z
card-last-reviewed:: 2022-11-14T16:37:19.444Z
card-last-score:: 3
- The sample variance, denoted by
s^2, is given by:-
s^2=\sum_{i=1}^{n} \frac{(x_i - \bar{x})^2}{n-1} - The sample standard deviation, denoted by
s, is the positive square root ofs^2, that is:-
s=\sqrt{s^2}
-
-
- The sample variance, denoted by
- A common measure of spread is the standard deviation, which takes into account how far each data value is from the mean.
- What is the range of a sample? #card
collapsed:: true
card-last-interval:: 33.64
card-repeats:: 4
card-ease-factor:: 2.9
card-next-schedule:: 2022-12-18T07:51:53.283Z
card-last-reviewed:: 2022-11-14T16:51:53.283Z
card-last-score:: 5
-
Shape
-
Graphical Summaries of Data
- Depends on the variable of interest.
- Categorical response variable -> bar chart or pie chart.
- Categorical response variable ^^with an explanatory variable^^ -> grouped bar chart.
- Continuous response variable -> histogram, boxplot, densit plot.
- Continuous response variable ^^with an explanatory variable^^ -> grouped boxplot.
- Categorical response variable -> bar chart or pie chart.
- Depends on the variable of interest.
-
- What is a boxplot? #card
card-last-interval:: 5.52
card-repeats:: 3
card-ease-factor:: 2.46
card-next-schedule:: 2022-11-20T04:34:53.491Z
card-last-reviewed:: 2022-11-14T16:34:53.492Z
card-last-score:: 3
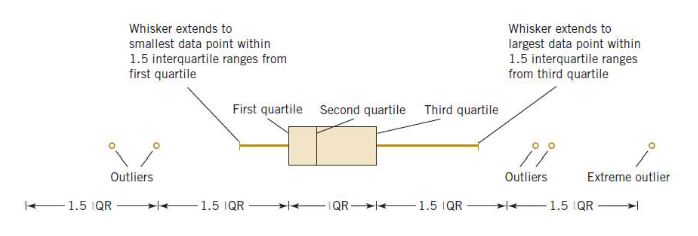
- A boxplot is a graphical display showing centre, spread, shape, & outliers.
- It displays the 5-number summary:
- min, Q1, median, Q3, max
- What is a boxplot? #card
card-last-interval:: 5.52
card-repeats:: 3
card-ease-factor:: 2.46
card-next-schedule:: 2022-11-20T04:34:53.491Z
card-last-reviewed:: 2022-11-14T16:34:53.492Z
card-last-score:: 3
- What is a histogram? #card
card-last-interval:: -1
card-repeats:: 1
card-ease-factor:: 2.7
card-next-schedule:: 2022-11-15T00:00:00.000Z
card-last-reviewed:: 2022-11-14T20:00:35.072Z
card-last-score:: 1
- Histograms are useful to show the general shape, location, and spread of data values.
- Representation by area.
- Construction
- Determine range of data minimum, maximum.
- Split into convenient intervals or bins.
- Usually use 5 to 15 intervals.
- Count number of observations in each interval - frequency.
- When talking about the shape of the data, make sure to address the following 3 questions:
-
- Does the histogram have a single, central hump or several well-separated bumps?
- Is the histogram or boxplot symmetric, or more spread out in one direction (skewed)?
- Any unusual features? e.g.., outliers, spikes.
-
-
Explanatory & Response Variables
collapsed:: true- To identify the explanatory variable in a pair of variables, identify which of the two is suspected of affecting the other and plan an appropriate analysis
- explanatory variable -might effect-> response variable
- continent -might effect-> life expectancy.
- explanatory variable -might effect-> response variable
- To identify the explanatory variable in a pair of variables, identify which of the two is suspected of affecting the other and plan an appropriate analysis
-
-
-
R Markdown
- What is R Markdown? #card
card-last-interval:: 28.93
card-repeats:: 4
card-ease-factor:: 2.56
card-next-schedule:: 2022-12-13T14:49:15.636Z
card-last-reviewed:: 2022-11-14T16:49:15.637Z
card-last-score:: 5
- R Markdown is a file format for making ^^dynamic documents in R.^^
- R Markdown is written in Markdown and contains chunks of embedded R code (data management, summaries, graphics, analysis & interpretation) all in one document.
- Documents can be knitted to HTML, PDF, Word, and many other formats.
-
Key Benefits of R Markdown
- Makes it easy to produce statistical reports with code, analysis, outputs, and write-up all in one place.
- Perfect for reproducible research.
- Easy to convert to different document types.
-
Structure
- R Markdown contains three types of content:
- A YAML Header.
- Text, formatted with Markdown.
- Code chunks.
- R Markdown contains three types of content:
- What is R Markdown? #card
card-last-interval:: 28.93
card-repeats:: 4
card-ease-factor:: 2.56
card-next-schedule:: 2022-12-13T14:49:15.636Z
card-last-reviewed:: 2022-11-14T16:49:15.637Z
card-last-score:: 5


